


Sellvisor Features
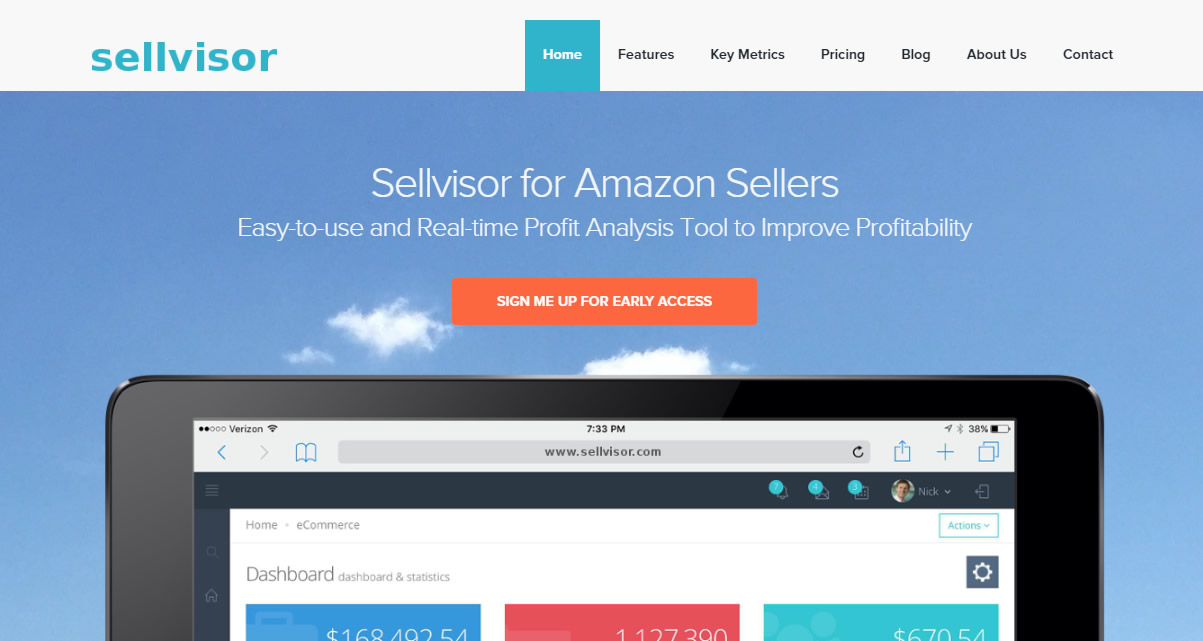
Sellvisor is a cloud-based Amazon Seller Software, which seamlessly connects to your Amazon Seller Account to provide you item-level actionable advice and key financial performance indicators, such as adjusted gross profit, Return-on-Investment (ROI), inventory turnover rate, and GMROII.
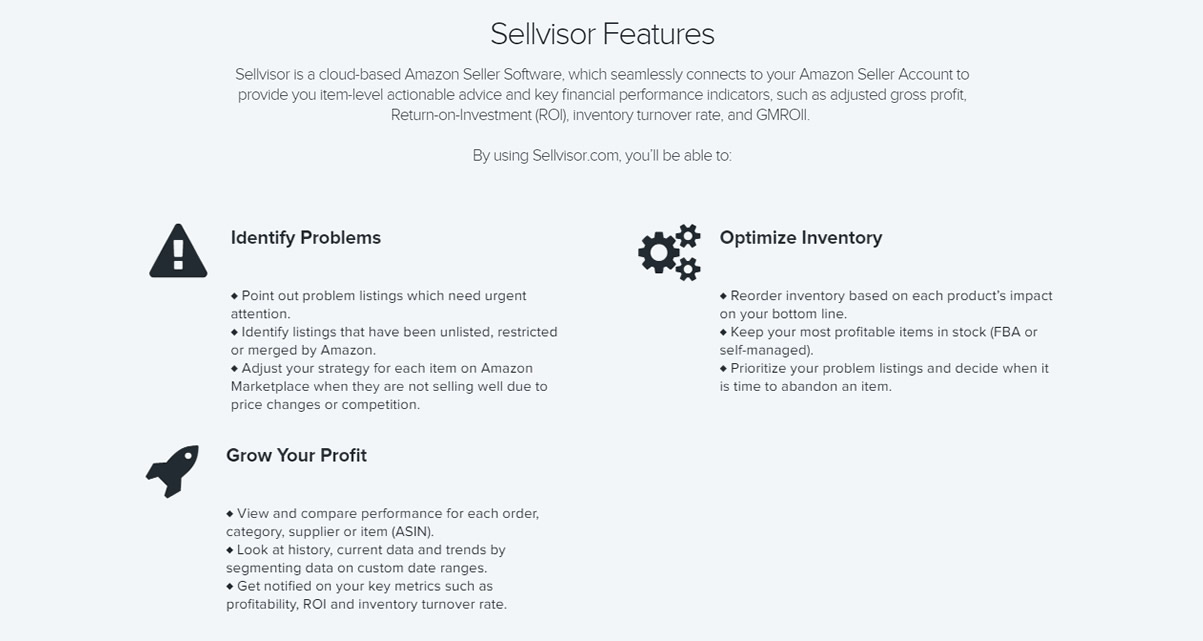
Identify Problems
- Point out problem listings which need urgent attention.
- Identify listings that have been unlisted, restricted or merged by Amazon.
- Adjust your strategy for each item on Amazon Marketplace when they are not selling well due to price changes or competition.
Optimize Inventory
- Reorder inventory based on each product’s impact on your bottom line.
- Keep your most profitable items in stock (FBA or self-managed).
- Prioritize your problem listings and decide when it is time to abandon an item.
Grow Your Profit
- View and compare performance for each order, category, supplier or item (ASIN).
- Look at history, current data and trends by segmenting data on custom date ranges.
- Get notified on your key metrics such as profitability, ROI and inventory turnover rate.
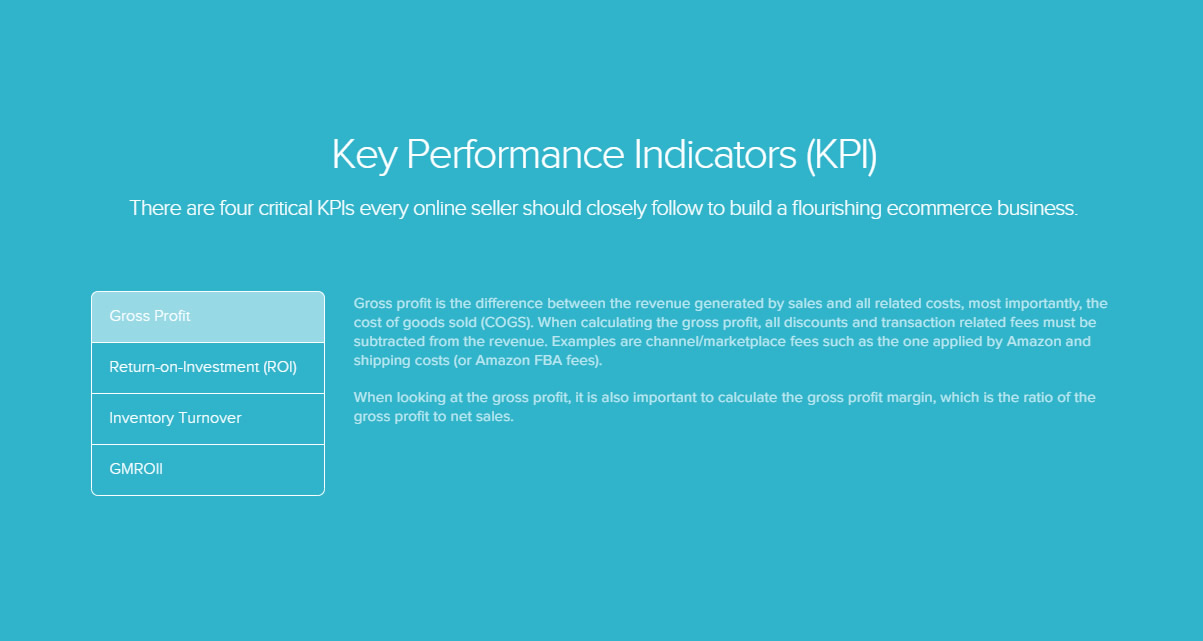
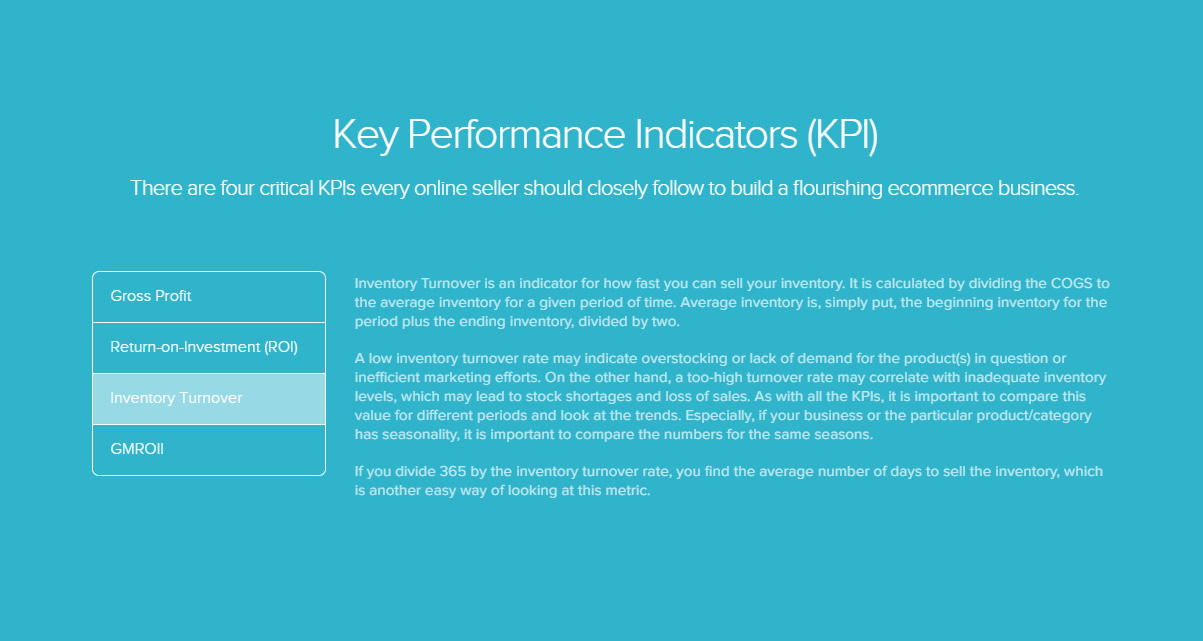
Key Performance Indicators (KPI)
There are four critical KPIs every online seller should closely follow to build a flourishing ecommerce business.
Gross profit
Gross profit is the difference between the revenue generated by sales and all related costs, most importantly, the cost of goods sold (COGS). When calculating the gross profit, all discounts and transaction related fees must be subtracted from the revenue. Examples are channel/marketplace fees such as the one applied by Amazon and shipping costs (or Amazon FBA fees).
When looking at the gross profit, it is also important to calculate the gross profit margin, which is the ratio of the gross profit to net sales.
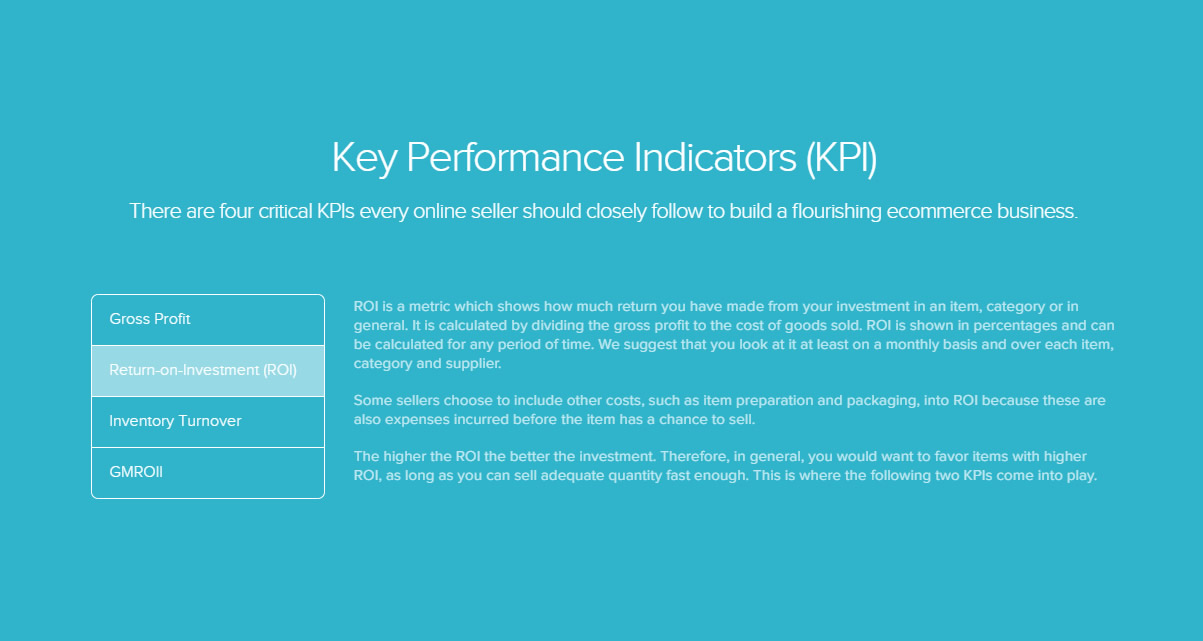
Return-on-Investment (ROI)
ROI is a metric which shows how much return you have made from your investment in an item, category or in general. It is calculated by dividing the gross profit to the cost of goods sold. ROI is shown in percentages and can be calculated for any period of time. We suggest that you look at it at least on a monthly basis and over each item, category and supplier.
Some sellers choose to include other costs, such as item preparation and packaging, into ROI because these are also expenses incurred before the item has a chance to sell.
The higher the ROI the better the investment. Therefore, in general, you would want to favor items with higher ROI, as long as you can sell adequate quantity fast enough. This is where the following two KPIs come into play.
Inventory Turnover
Inventory Turnover is an indicator for how fast you can sell your inventory. It is calculated by dividing the COGS to the average inventory for a given period of time. Average inventory is, simply put, the beginning inventory for the period plus the ending inventory, divided by two.
A low inventory turnover rate may indicate overstocking or lack of demand for the product(s) in question or inefficient marketing efforts. On the other hand, a too-high turnover rate may correlate with inadequate inventory levels, which may lead to stock shortages and loss of sales. As with all the KPIs, it is important to compare this value for different periods and look at the trends. Especially, if your business or the particular product/category has seasonality, it is important to compare the numbers for the same seasons.
If you divide 365 by the inventory turnover rate, you find the average number of days to sell the inventory, which is another easy way of looking at this metric.
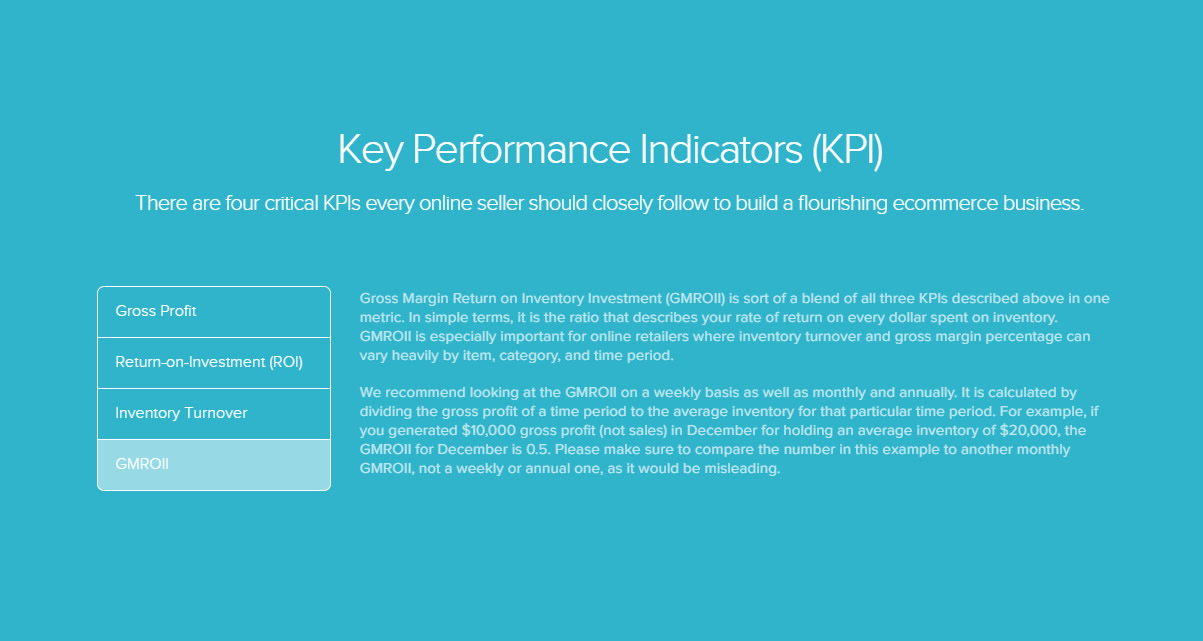
Gross Margin Return on Inventory Investment (GMROII)
Gross Margin Return on Inventory Investment (GMROII) is sort of a blend of all three KPIs described above in one metric. In simple terms, it is the ratio that describes your rate of return on every dollar spent on inventory.
GMROII is especially important for online retailers where inventory turnover and gross margin percentage can vary heavily by item, category, and time period.
We recommend looking at the GMROII on a weekly basis as well as monthly and annually. It is calculated by dividing the gross profit of a time period to the average inventory for that particular time period. For example, if you generated $10,000 gross profit (not sales) in December for holding an average inventory of $20,000, the GMROII for December is 0.5. Please make sure to compare the number in this example to another monthly GMROII, not a weekly or annual one, as it would be misleading.
